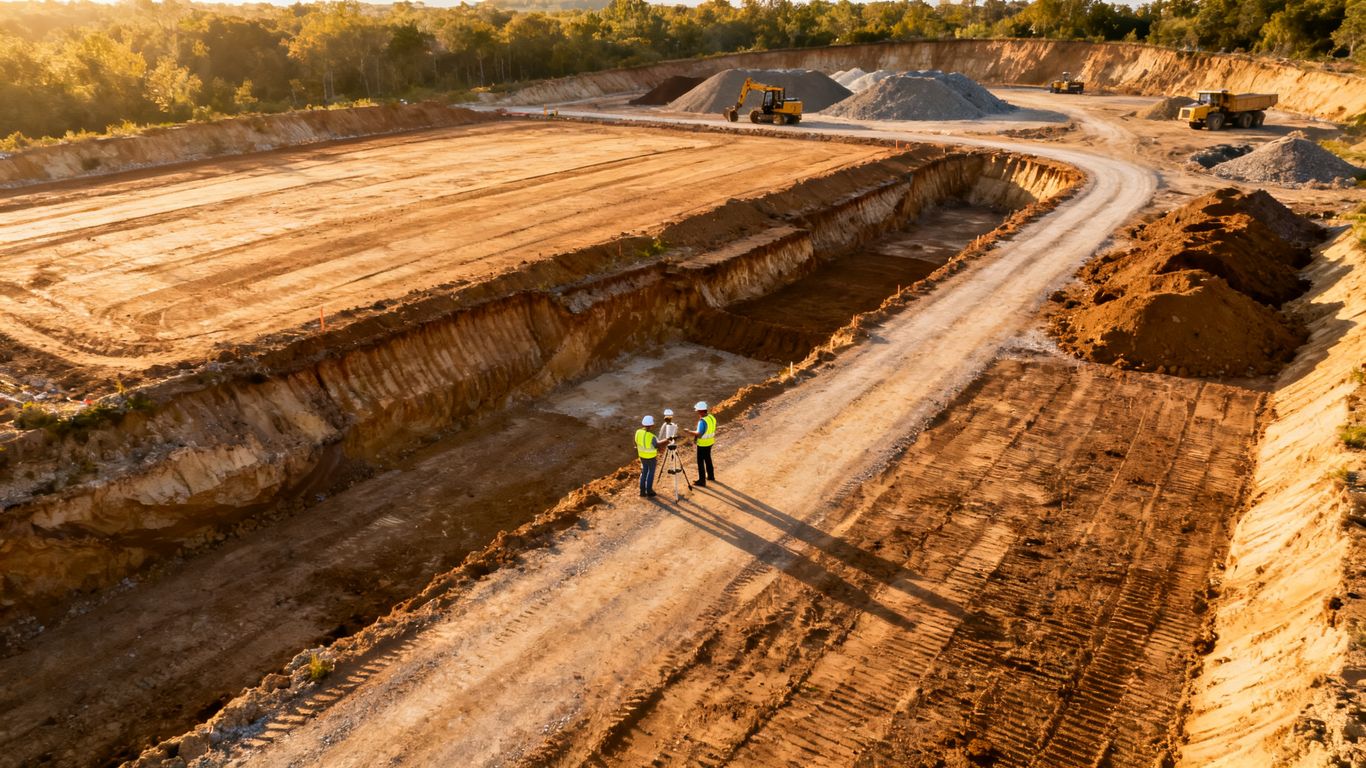
Drone earthwork cut and fill analysis: A practical guide to accurate volume calculations
Key Takeaways
Accurate earthwork quantities begin with sound field data and end with careful interpretation. A drone workflow can make that process faster and more repeatable, but only when survey planning, processing, and validation are treated as one chain.
- Define the site limits, design reference, and measurement objective before flying.
- Use suitable imagery, control points, and processing settings to build reliable surfaces.
- Compare the existing ground surface with the intended design surface to calculate cut and fill.
- Validate drone-derived elevations against independent checkpoints and document limitations.
- Turn volume results into practical decisions about grading, hauling, progress, and reporting.
Understand the fundamentals of cut and fill analysis
Drone earthwork cut and fill analysis compares the terrain that exists today with the surface a project is intended to achieve. The difference between those surfaces shows where soil must be removed, where material must be added, and how much movement the work may require. The calculation sounds simple, but its reliability depends on how both surfaces are defined.
A useful analysis is more than a single volume number. It provides a spatial view of the site, helping teams see whether quantities are concentrated in a building pad, access road, drainage feature, or stockpile. That context makes the result easier to review with estimators, engineers, and field crews.
What cut and fill volumes measure
Cut volume is the amount of material above the target surface that must be excavated. Fill volume is the amount needed where the existing surface sits below the target. Net volume is the difference between the two, although a net balance should not be mistaken for a complete hauling plan because location, soil type, shrinkage, and suitability still matter.
The calculation is normally performed across a bounded area and a defined elevation model. Every cell, triangle, or sampled location contributes a small difference that is aggregated into a total. A cut and fill calculations guide can be useful when a team needs to connect those totals with material inventory, progress tracking, and cost control.
How terrain surfaces and elevation data work together
An elevation dataset gives each location a height relative to a coordinate system. When those heights are assembled into a raster, triangulated surface, or point cloud, they describe the shape of the site. The calculation then compares corresponding locations on the existing and design surfaces rather than treating the property as one flat block.
Resolution matters, but higher density does not automatically mean higher accuracy. Vegetation, standing water, dust, steep faces, and poor image geometry can all affect the surface. The goal is a dataset that captures the ground conditions relevant to the decision, with enough detail to describe breaks in slope and drainage features without creating false precision.
The difference between existing and design surfaces
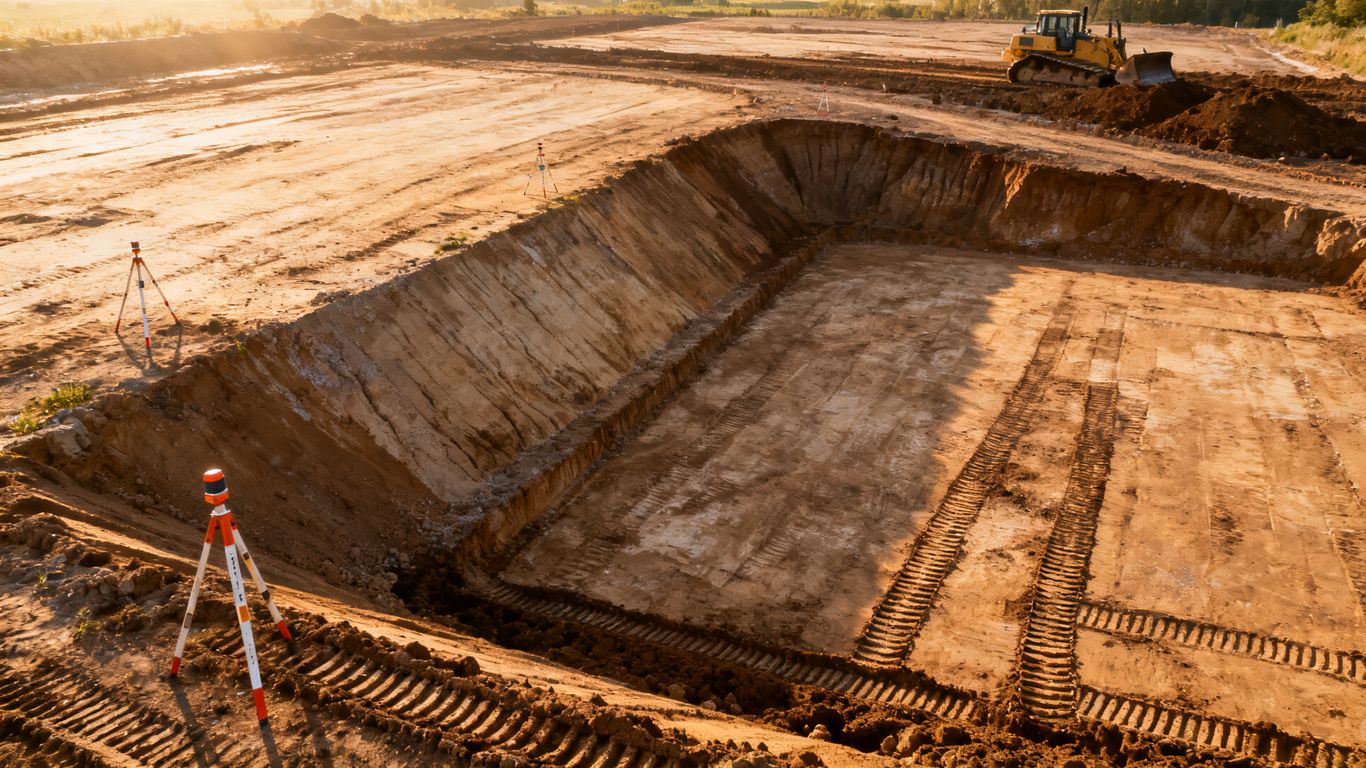
The existing surface describes conditions captured during the survey. Depending on the sensor and processing method, it may include exposed ground, vegetation, structures, equipment, or stockpiles. A design surface describes the intended grade, usually derived from engineering plans, a terrain model, contours, or a finished-grade file.
These surfaces must use compatible horizontal and vertical references. A small datum mismatch can create a systematic difference across the entire site, while an incorrectly clipped boundary can add or remove large quantities. Before calculating anything, confirm that the design file, survey data, units, and coordinate reference are aligned.
Why accurate volume calculations matter for project costs
Earthwork quantities influence bids, purchase orders, hauling schedules, disposal decisions, and payment reviews. An error spread across a large footprint can become expensive even when the elevation difference at any one point seems minor. Small elevation errors compound when they are repeated across thousands of square feet.
A clear calculation also gives the project team a defensible basis for discussion. It can show where material is moving, whether a grading phase is approaching its target, and whether a reported quantity matches observed site conditions. Accuracy is therefore not only a technical concern; it supports better communication and fewer avoidable surprises.
Plan a drone survey for reliable earthwork data
Good cut and fill work starts before the aircraft leaves the ground. The team needs to decide what surface will be measured, what area will be included, and how the results will be checked. A short planning conversation can prevent a long re-flight or an unusable model.
The survey should fit the site and the decision, not simply follow a default flight template. Consider access, active equipment, nearby obstacles, airspace, terrain changes, and the level of detail required. For projects in California, flight planning should also account for applicable operational and site-safety requirements.
Define the site boundary and survey objectives
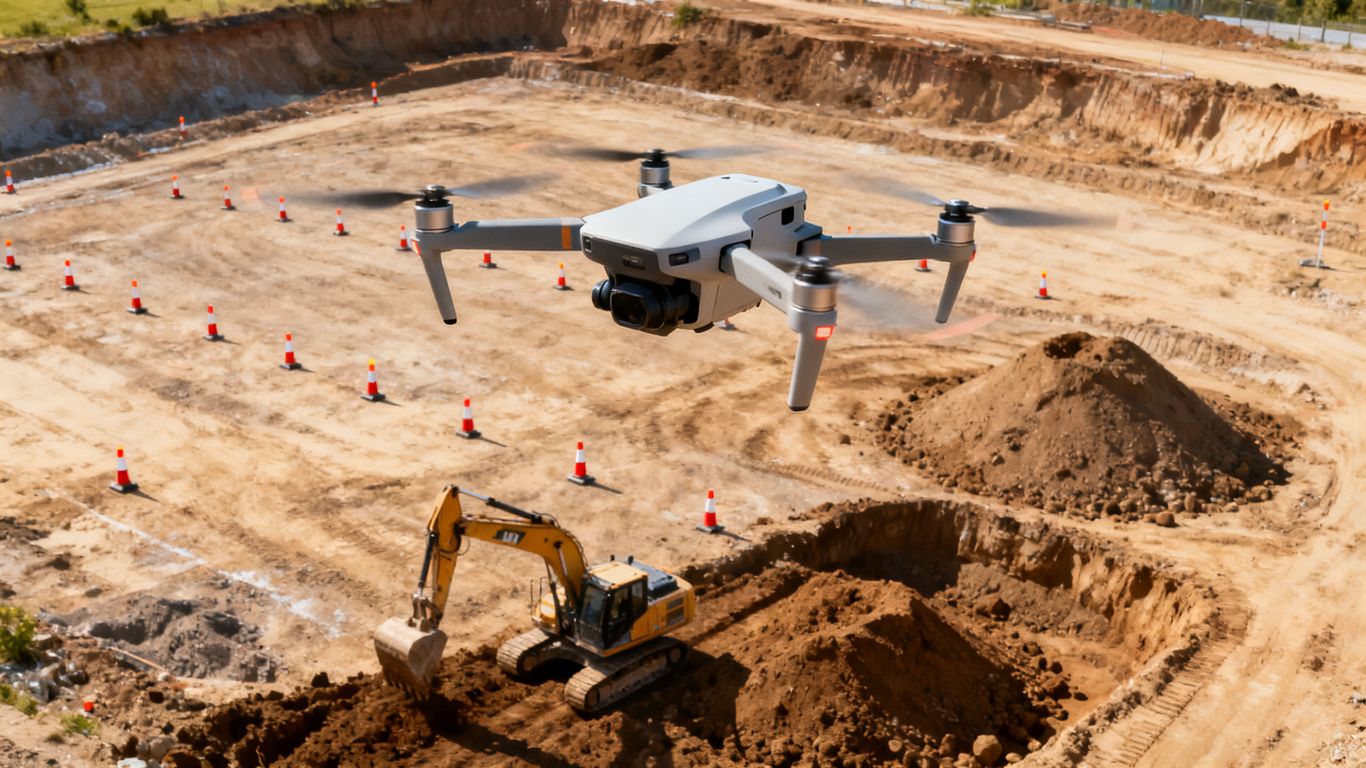
Draw the boundary broadly enough to capture tie-in areas, access routes, drainage edges, and nearby stockpiles that affect the calculation. At the same time, avoid including unrelated ground that could distort the quantity. Mark exclusions clearly, especially where the design surface ends at a property line or construction limit.
Then state the purpose in practical terms: preconstruction estimate, interim progress check, stockpile inventory, subgrade verification, or final comparison. The objective determines the required ground detail, reporting format, and validation effort. It also gives the processing team a clear test for whether the final data answers the original question.
Choose the right drone, camera, and flight settings
Photogrammetry can produce detailed visual and elevation information when imagery is sharp, well exposed, and sufficiently overlapping. LiDAR may be appropriate where vegetation, complex vertical surfaces, or limited visual texture make image-based reconstruction difficult. The choice should reflect the terrain and the deliverable rather than the aircraft alone.
Altitude, speed, overlap, shutter settings, and lighting all influence the result. Maintain a consistent ground sampling distance where possible, slow down for complex areas, and plan extra coverage around steep slopes or tall objects. A service such as Aerial LiDAR is documented as providing high-resolution 3D models and dense point clouds for terrain and structure analysis, while noting that its outputs are not survey-grade deliverables.
Place ground control points and checkpoints
Ground control points help tie the model to known coordinates, while checkpoints provide an independent way to test it. Place them across the site rather than clustering them in one convenient corner. Include higher and lower elevations, perimeter areas, and zones where the surface changes quickly.
Make each point visible in the imagery and record its position using an appropriate method. Keep checkpoints separate from the points used to control the model; otherwise, the accuracy check will not be independent. Clear markings, stable placement, and careful field notes matter as much as the number of points.
Account for terrain, weather, and site conditions
Sun angle, wind, dust, shadows, wet ground, and moving equipment can affect capture quality. Avoid flying when gusts create motion blur or when changing light produces inconsistent exposures. If the site is active, coordinate with the superintendent and define safe launch, recovery, and exclusion areas.
Steep cuts and stockpiles deserve particular attention because their faces can be hidden from a single direction. Plan flight lines and oblique coverage where appropriate, and document areas that could not be safely or clearly captured. A transparent limitation is more useful than an unexplained gap in the final quantity.
Capture and process the survey data
Once the plan is set, capture should produce a consistent set of overlapping observations rather than a collection of attractive aerial photographs. File naming, flight logs, control-point records, and site notes should travel with the imagery. Those simple habits make later review much easier.
Processing turns the imagery or sensor measurements into several related products. Each product answers a different question, and none should be accepted without a basic quality check. The final earthwork result is only as dependable as the weakest important input.
Collect overlapping aerial imagery
The aircraft should follow the planned pattern at a steady height and speed. Forward and side overlap give the processing software repeated views of the same ground features, allowing it to estimate camera positions and reconstruct three-dimensional geometry. Gaps, excessive blur, and inconsistent exposure can leave holes or distortions in the model.
Review the images before leaving the site when possible. Check that the boundary is covered, control points are visible, and critical areas such as pad edges or stockpile toes are not hidden by equipment. A quick field review can save the cost of returning after the site has changed.
Build an orthomosaic and digital surface model
An orthomosaic combines corrected aerial images into a map-like view with consistent scale. It helps the team inspect site conditions, trace boundaries, and compare visible features over time. A digital surface model adds elevation to the mapped information and may include objects above the bare ground.
The orthomosaic is often the easiest product for a project manager to review, while the surface model supports measurement and analysis. Aeroskape describes 3D aerial modeling from imagery as supporting site planning, progress monitoring, environmental assessments, and detailed site visualizations. Those uses depend on the model being processed with appropriate coverage and control.
Generate a point cloud and digital terrain model
A point cloud stores many three-dimensional observations and can reveal the shape of slopes, piles, structures, and other features. A digital terrain model attempts to represent the ground surface by filtering or classifying points that do not belong to the terrain. The distinction is crucial: a surface that includes vegetation or equipment may not be suitable for earthwork quantities.
Inspect classification around retaining walls, berms, brush, trenches, and stockpiles. Automated filtering can help, but it should not replace review of the areas that drive the result. If the project requires a bare-earth interpretation, record how non-ground points were handled.
Check georeferencing and data quality
Confirm the coordinate system, vertical reference, units, and control-point assignments before exporting surfaces. Look for warped edges, holes, spikes, duplicate flights, and abrupt elevation steps. Compare model coordinates with field notes and make sure the intended survey date is attached to the correct dataset.
A practical quality review should end with a decision: accept the data, correct and reprocess it, or recapture part of the site. Do not hide uncertainty by reporting more decimal places. Precision in the display cannot compensate for weak geometry or incomplete coverage.
Calculate cut and fill volumes
Volume calculation is the point where a mapped surface becomes a construction quantity. The method is straightforward when the existing and design surfaces are clean, aligned, and clipped to the same area. It becomes less reliable when boundaries, breaklines, units, or surface types are left implicit.
Keep the calculation settings with the result. Someone reviewing the number later should be able to identify the source surfaces, area, date, vertical reference, and treatment of gaps. That record is especially valuable when quantities are compared across multiple phases.
Compare existing ground with the design surface
Load the existing ground surface and the approved design surface into the same coordinate framework. Inspect them visually before calculating, looking for shifted boundaries, missing design features, or areas where the existing model contains a stockpile that the design does not address. The comparison should reflect the construction question being asked.
Where the design has distinct pads, roads, channels, or terraces, consider analyzing those regions separately. A single site-wide number can conceal a surplus in one area and a shortage in another. Regional quantities are often more useful for scheduling and material movement.
Set boundaries, elevations, and calculation intervals
Draw or import a clear polygon for the calculation area. Confirm whether the boundary follows a property line, a phase limit, a grading limit, or a material pile. Use consistent units and verify the vertical reference before selecting the calculation method or grid spacing.
The following settings should be recorded for each run because they affect repeatability:
- Source surface names and capture dates.
- Design file revision and approved grading area.
- Horizontal and vertical coordinate references.
- Calculation boundary, grid, or triangulation method.
- Treatment of holes, vegetation, structures, and excluded areas.
After the calculation, rerun a small test area or compare results using a reasonable alternate interval. If the quantity changes substantially, investigate the surface and boundary rather than choosing the more convenient number. The purpose of the settings is to make the analysis explainable.
Interpret cut, fill, and net volume results
Cut and fill totals should be read alongside a map. A net fill result may still require imported material if the cut is in the wrong location or unsuitable for reuse. Similarly, a net cut result does not automatically mean that all excavated material can be stockpiled or used elsewhere.
A useful report separates gross cut, gross fill, and net balance, then identifies the areas producing the largest values. Include the calculation date and surface versions so a later comparison does not confuse a changed design with a changed site. Aeroskape’s focus on organized, visual, decision-ready aerial information fits this reporting need without turning a volume estimate into a legal survey deliverable.
Handle stockpiles, trenches, slopes, and irregular areas
Irregular features need deliberate boundaries and sometimes separate surfaces. A stockpile should be measured from an appropriate base, not from an arbitrary flat plane. Trenches may require enough point density to capture their bottoms, while steep slopes may need additional viewpoints to avoid shadowed or occluded faces.
Break a complicated site into logical regions when one calculation would mix unrelated conditions. Review the toe and crest of each pile, the top and bottom of each trench, and the transition between existing and designed grades. This approach takes a little longer but produces quantities that field teams can actually use.
Validate the accuracy of drone-based measurements
Validation is not a formality added after the calculation. It is how the team learns whether the surface is fit for the intended decision and where its limitations lie. A good validation record can also make later discussions more constructive because it separates measured conditions from assumptions.
No aerial dataset should be treated as universally accurate across every surface type. Accuracy varies with control, equipment, processing, terrain, and conditions during capture. The right question is whether the observed error is acceptable for the project use.
Compare drone results with traditional survey points
Use independent field points to compare measured elevations with the corresponding elevations in the model. Check both the average difference and the spread of differences, since a small average can conceal localized errors. Sample important features such as pad corners, drainage inverts, breaklines, and pile toes.
Traditional survey points can serve as a validation reference without implying that the drone workflow itself provides professional land surveying. When a project requires survey-grade or legal deliverables, involve a licensed Professional Land Surveyor. Keep the roles and intended uses clear in the report.
Identify gaps, vegetation, and surface artifacts
Inspect the model for holes, noisy patches, floating points, blurred edges, and surfaces that bridge across open space. Vegetation may be mistaken for ground in photogrammetry, while machinery and temporary materials can appear as permanent terrain. Water and dark surfaces can also reduce the quality of reconstructed points.
Compare suspicious areas with the orthomosaic and field notes. If the surface cannot be confidently interpreted, exclude it, collect additional data, or label the result as an estimate. Quietly allowing an uncertain patch into the total is usually more damaging than acknowledging a limitation.
Review checkpoints and elevation tolerances
Checkpoints should be evaluated separately from ground control points. Summarize the differences by location and elevation range, then decide whether the results meet the tolerance appropriate to the task. A grading-progress review may tolerate a different error than a quantity used for a contractual payment decision.
Do not rely on a single pass or one favorable checkpoint. Look for patterns, such as all points on one side of the site being high, which may indicate a reference or processing issue. If the pattern is localized, examine coverage, vegetation, and surface classification in that area.
Document assumptions and sources of measurement error
The final report should state the capture date, equipment and sensor type, control and checkpoint approach, surface-generation method, boundaries, units, and exclusions. Note weather, active work, inaccessible areas, and any assumptions about pile bases or design revisions. These details give the number a proper context.
A concise limitations statement is not a weakness. It tells the reader how to use the result and when a new capture or licensed survey is warranted. Aeroskape’s construction work is centered on aerial data capture and organized project information, not on providing professional land surveying services under California Business and Professions Code §8726.
Apply analysis results to construction decisions
A volume calculation earns its value when it changes what the project team does next. The same underlying surfaces can support progress reviews, material planning, field coordination, and owner reporting. The key is to present the result in a form that matches each audience.
Repeatability matters here. If each flight uses different boundaries or undocumented processing settings, apparent changes may reflect method rather than construction. Use consistent naming, dates, and comparison areas so the trend remains readable.
Track grading progress across project phases
Capture the site at agreed milestones and compare each existing surface with the relevant design revision. A progress map can show where grading is complete, where cut or fill remains, and where the site has changed unexpectedly. Overlaying phase boundaries helps managers focus on work that affects the next activity.
Aerial data collection can also reduce the need for people to enter active or difficult areas for visual checks. Aeroskape describes project-manager-focused aerial data collection as providing site insights, progress monitoring, and stakeholder communication support. The output still needs review, but it can give the team a more current shared view.
Estimate material movement and hauling requirements
Use separate cut and fill regions to estimate where material may originate and where it may be placed. Then add practical factors such as material suitability, swell and shrink, moisture, haul distance, access, and sequencing. A net balance alone cannot predict truck counts or disposal needs.
Stockpiles should be measured on a consistent schedule when inventory affects production or billing. Keep the capture dates and pile boundaries consistent, and explain any change in the assumed base. This creates a more useful record of material movement than a single isolated volume.
Create cut and fill maps for field teams
Field teams usually need a clear map more than a dense point cloud. Use readable color ranges, labeled areas, a legend, date, boundary, and a short explanation of what positive and negative values mean. Avoid color scales that make small differences look more certain than they are.
Pair the map with a table of regional quantities and a note about validation. Mark access routes, exclusion zones, and areas requiring rework where those features are relevant. If the team needs project-specific support with aerial information, it can request a quote for the appropriate service scope.
Share reports with owners, engineers, and contractors
Each audience may need a different level of detail, but the underlying figures should remain consistent. Owners may want cost and schedule implications, engineers may need surfaces and control information, and contractors may need locations, quantities, and next actions. A short summary linked to the detailed files keeps the discussion focused.
Reports should identify the data date and design revision prominently. Include a map, gross cut and fill, net balance, validation notes, assumptions, and any excluded areas. That structure helps prevent an interim measurement from being mistaken for a final or legal survey document.
Plan Your Next Survey
If your team needs organized aerial data for construction planning, progress monitoring, or earthwork review, Aeroskape can discuss the site, intended use, and appropriate capture approach. Start with the decision the data must support, then define the scope, timing, and deliverables around it.
Conclusion
Reliable drone earthwork cut and fill analysis comes from a complete workflow: define the question, capture suitable data, build compatible surfaces, calculate within a clear boundary, and validate the result. When the assumptions and limitations are visible, the numbers become much easier to use for grading, material planning, progress reporting, and project coordination.
Frequently Asked Questions
What is drone earthwork cut and fill analysis?
It is the comparison of an existing terrain surface with a design surface using drone-derived elevation data to estimate where material must be removed or added and how much volume is involved.
What data is needed for a cut and fill calculation?
You generally need a suitable existing ground surface, an approved design surface, a defined calculation boundary, compatible coordinate references, and enough control or validation information to assess data quality.
Is a digital surface model the same as a digital terrain model?
No. A digital surface model may include objects such as vegetation, equipment, or structures, while a digital terrain model is intended to represent the ground after relevant non-ground points have been filtered or classified.
How do ground control points improve drone mapping?
Ground control points help connect the model to known positions and elevations. They can reduce systematic spatial error when placed and measured appropriately across the survey area.
Why should checkpoints be separate from ground control points?
Independent checkpoints provide a more honest test of model accuracy. If the same points control and validate the model, the reported agreement may not reflect performance on unobserved locations.
Can drones measure stockpile volumes?
Yes, drone-derived surfaces can be used to estimate stockpile volumes when the pile is captured clearly and its base or comparison surface is defined. Irregular piles, blocked toes, and uncertain bases should be documented.
When should a licensed surveyor be involved?
A licensed Professional Land Surveyor should be involved when the project requires professional land surveying, survey-grade or legal deliverables, boundary work, or other services governed by applicable professional requirements.