Wildfire risk assessment aerial imagery in Northern California: A practical guide
Key Takeaways
A useful wildfire assessment connects what is visible from above with terrain, weather, structures, and decisions on the ground.
- Separate wildfire hazard from exposure and vulnerability before assigning risk.
- Match imagery type, resolution, coverage, and timing to the assessment question.
- Combine aerial images with elevation, vegetation, fire history, and weather records.
- Validate mapped observations through field checks and documented confidence levels.
- Turn findings into practical priorities for fuel reduction, access, resilience, and monitoring.
Understanding wildfire risk across Northern California
Wildfire risk assessment aerial imagery northern california projects need more than attractive overhead photographs. The useful question is how landscape conditions could affect people, structures, infrastructure, and response options. A clear assessment therefore combines imagery with context, careful classification, and an honest account of uncertainty.
How hazard, exposure, and vulnerability differ
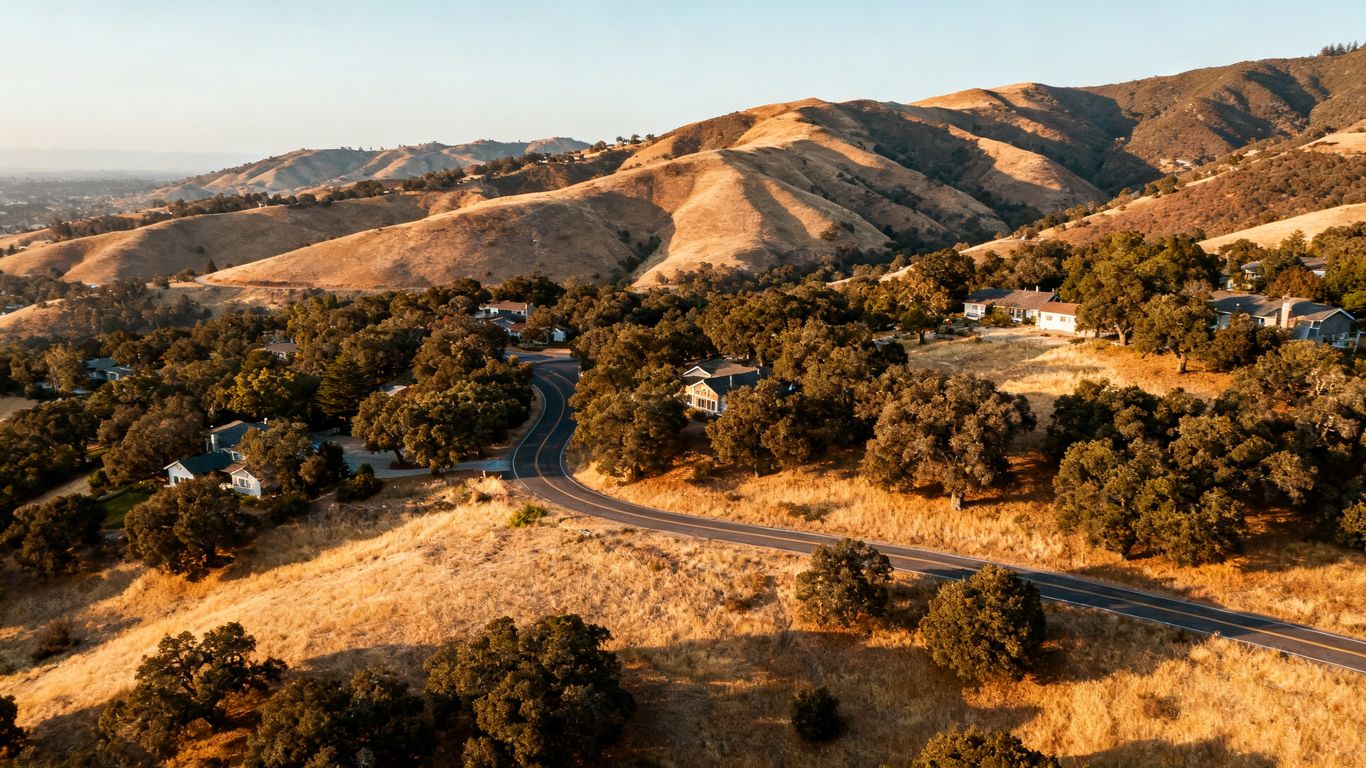
Hazard describes the likelihood and behavior of wildfire-related threats, such as fast-moving fire, embers, or intense heat. Exposure describes what lies in the path, including homes, roads, utilities, farms, and public facilities. Vulnerability concerns how readily those exposed assets could be damaged and how difficult it may be for people or emergency services to respond.
Keeping these terms separate prevents a dense stand of vegetation from being treated as a complete risk score. An image may show continuous fuels, but the final assessment also needs to ask what is nearby, how it is built, and whether access or evacuation is constrained.
Why terrain, vegetation, and weather create regional variation
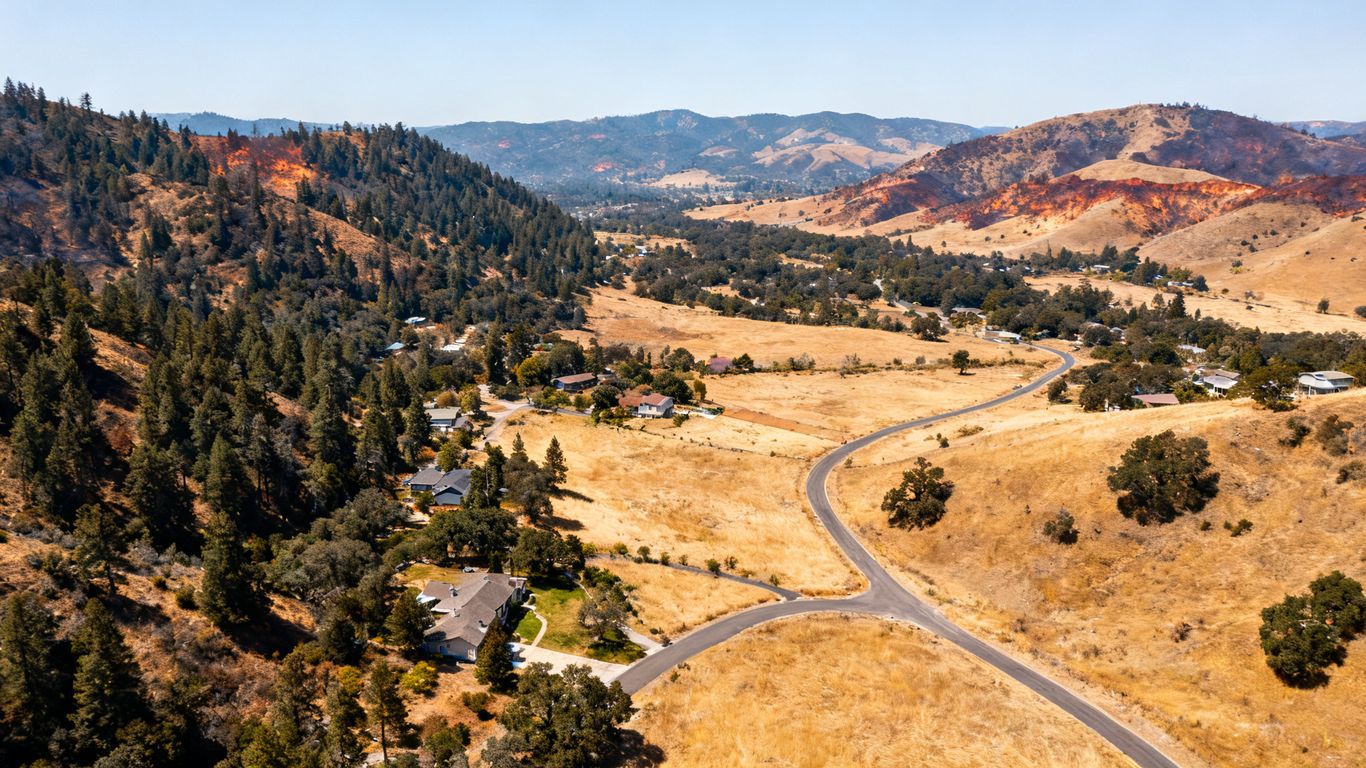
Northern California contains steep canyons, rolling foothills, coastal ranges, dry interior valleys, and heavily settled edges. Slope can accelerate fire spread, while aspect influences solar exposure and fuel moisture. Wind, drought, recent vegetation change, and local sheltering effects can make two neighboring properties behave very differently.
Aerial imagery helps reveal the spatial pattern, but it does not replace weather records or terrain analysis. The strongest interpretation compares what appears in the image with elevation, surface form, vegetation condition, and the season in which the capture occurred.
Wildfire risk factors in the wildland–urban interface
In the wildland–urban interface, risk often comes from connections rather than a single feature. Shrubs may touch a fence, a tree canopy may overhang a roof, and narrow roads may pass through dense vegetation. Outbuildings, utility corridors, and neighboring parcels can extend the chain of exposure beyond a property boundary.
A useful review records both the wildland edge and the built environment. California-wide structure relationships and neighborhood density can add context to aerial observations; the California Structure Graph is one example of a dataset developed to examine how structures relate spatially.
How seasonal conditions change assessment results
An image captured after winter rain may show greener, less visibly stressed vegetation than one captured at the end of summer. Leaf-on and leaf-off conditions also change canopy visibility, while smoke, haze, shadows, and low sun can hide important details. The date and conditions of every capture should be part of the assessment record.
Seasonal comparison is most useful when the same area is revisited using consistent boundaries and documented methods. That makes change easier to distinguish from differences caused only by lighting, sensor angle, or vegetation phenology.
Choosing aerial imagery and supporting data
The right imagery depends on the question, the size of the study area, and how quickly conditions may change. A property inspection may need close detail, while a regional screening effort needs broad, repeatable coverage. Good planning also accounts for flight safety, permissions, processing time, and how the final information will be used.
Comparing drone, aircraft, and satellite imagery
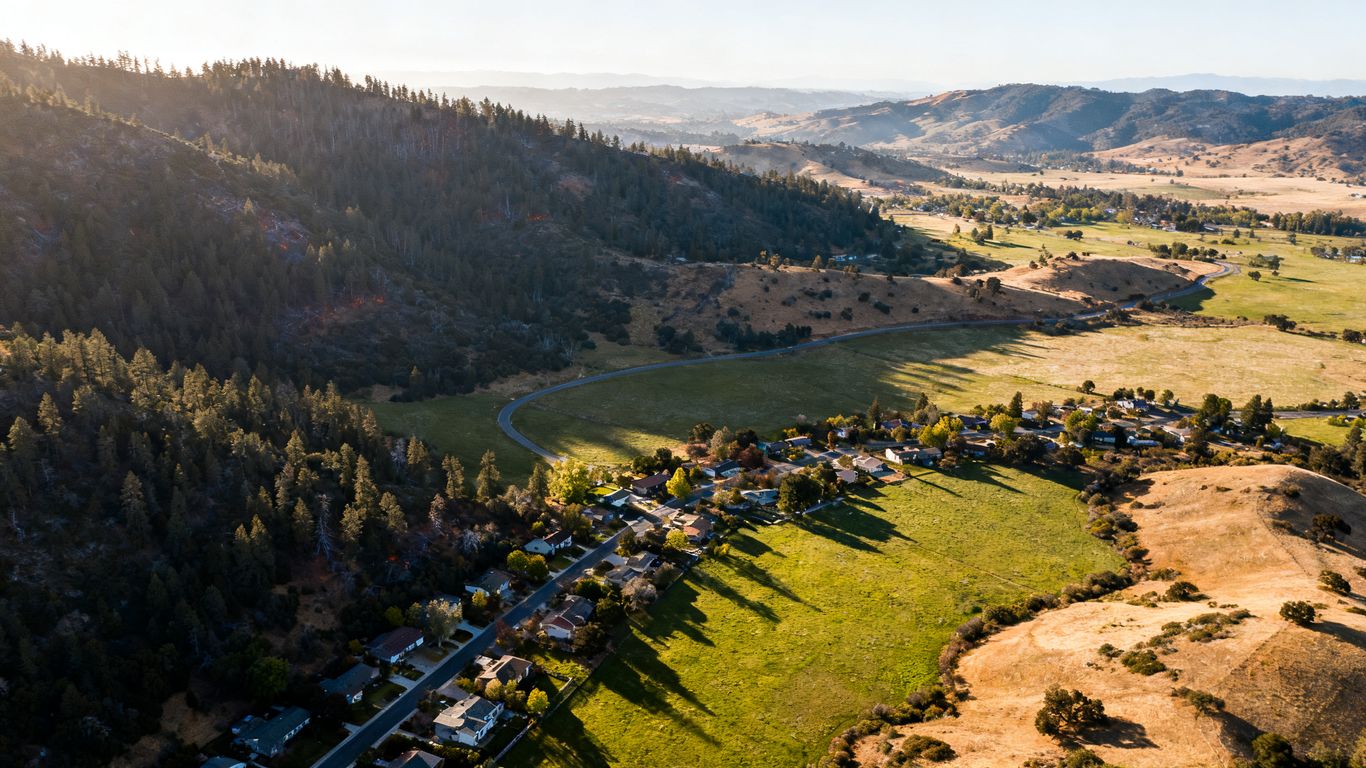
Drones can capture detailed views of individual properties, roads, utility corridors, and vegetation edges when conditions permit. Aircraft can cover larger areas efficiently, while satellites support broad-area comparison and repeat observation. These sources are complementary rather than interchangeable.
Use the platform that fits the decision. A close inspection of roof surroundings calls for different detail than a county-scale change review, and a rapid post-fire question may favor available satellite coverage over waiting for a new flight.
Selecting resolution, coverage, and update frequency
Resolution should be high enough to identify the features that matter, but higher detail is not automatically better if the project cannot cover the full study area or repeat the capture. Define the minimum mapping unit before selecting a sensor. Then decide how often the area must be revisited as fuels, construction, weather, or fire effects change.
A practical capture plan usually answers four questions: what must be seen, how much land must be covered, when must the information be available, and who will act on it. Aerial data collection can support vegetation, tree-health, and canopy-cover decisions when an environmental assessment needs a more organized view of the landscape.
Combining imagery with elevation and vegetation data
Images become more informative when they are aligned with elevation models, slope and aspect, vegetation condition, land cover, and property boundaries. Elevation helps explain why a fuel break may be difficult to reach or why a drainage could concentrate runoff after a fire. Vegetation data helps distinguish isolated patches from continuous fuels.
The layers should share a coordinate system, date reference, and documented accuracy. Otherwise, apparent mismatches may reflect registration problems rather than real conditions.
Using historical fire perimeters and weather records
Past fire perimeters provide context for recurrence, burn severity, and recovery. Weather records help explain why a particular capture may show dry fuels, smoke, or unusual visibility. Neither dataset predicts the next fire by itself, but together they help reviewers interpret current imagery without treating it as a timeless snapshot.
For post-fire work, multitemporal imagery can also reveal erosion and debris-flow responses. The post-wildfire erosion study illustrates why burned slopes should be reviewed alongside rainfall and terrain, not only by looking at the burn perimeter.
Building a wildfire risk assessment workflow
A repeatable workflow turns scattered images and GIS layers into an assessment that another reviewer can understand. Start with a defined question and study boundary, then preserve the original files and record every processing step. The result should be organized enough to support a decision, not just a folder of aerial photographs.
Defining the property, community, or landscape study area
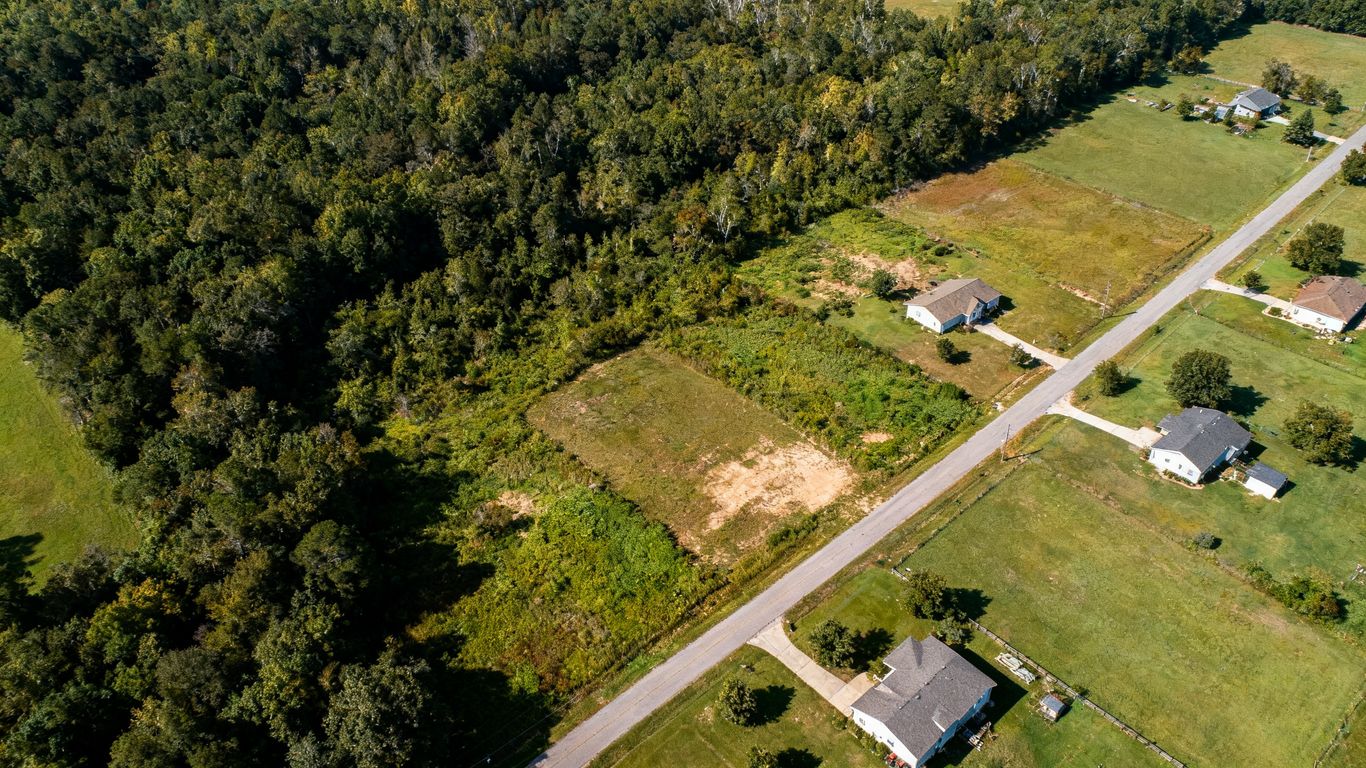
Draw the boundary around the decision, not merely around the parcel. A property review may need neighboring vegetation, access roads, hydrants, and nearby structures. A community review may need evacuation routes, utility corridors, public buildings, and landscape-scale fuel continuity.
Record the boundary version, date, coordinate reference, and exclusions. Clear scope makes later comparisons possible and prevents a narrow image footprint from being mistaken for a complete risk picture.
Preparing and standardizing imagery for analysis
Before interpreting imagery, check capture date, ground coverage, overlap, georeferencing, resolution, and visible defects. Standardize file naming and metadata, and preserve an untouched source copy. Shadows, glare, haze, and uneven illumination should be marked rather than silently corrected away.
Standardization matters when several flights or sources are compared. A consistent workflow reduces false change and makes it easier for field teams, planners, and technical reviewers to trace an observation back to its source.
Mapping fuels, structures, roads, and defensible space
Create separate layers for vegetation types, fuel continuity, structures, roof surroundings, roads, driveways, slopes, and apparent defensible-space conditions. Avoid collapsing all vegetation into one category; grass, shrub, litter, and canopy can affect interpretation differently. Likewise, a building footprint alone says little about attachments, access, or nearby combustible features.
A compact field-and-imagery checklist can keep the first pass focused:
- Mark continuous and interrupted fuel zones.
- Identify structures near vegetation or narrow access points.
- Trace primary and alternate routes for emergency movement.
- Record features that require field confirmation.
This list is a starting structure, not a substitute for professional judgment or local requirements. It helps teams make the same observations across multiple properties and revisit unresolved questions systematically.
Integrating geographic information system layers
GIS integration allows imagery observations to be compared with parcels, roads, topography, land ownership, utilities, fire history, and emergency facilities. Keep source dates and layer quality visible in the project record. A current image paired with an outdated road layer can create a misleading sense of precision.
Outputs should be easy to review: annotated maps, feature tables, change areas, and links to source imagery. When a decision depends on a boundary or measurement, show how that value was derived.
Automating repetitive tasks with AI and machine learning
Automation can help sort imagery, identify repeated features, flag likely changes, and prepare large areas for human review. It should narrow attention, not conceal uncertainty or replace field verification. Training data, thresholds, and review rules should be documented whenever an automated result influences prioritization.
Aeroskape provides organized aerial information for project decisions, and its Aerial LiDAR offering is documented for detailed topographic maps, earthwork calculations, and progress monitoring. Those capabilities can support terrain-oriented work when the project scope calls for them, while wildfire conclusions still require appropriate validation.
Identifying wildfire risk indicators in imagery
Imagery-based indicators are clues that need interpretation, not automatic verdicts. The reviewer should distinguish visible conditions from assumptions and note what the image cannot show. A strong map makes those limits clear while directing attention to the places where a field visit or additional data will matter most.
Detecting vegetation density and fuel continuity
Look for uninterrupted grasses, shrubs, ladder fuels, dense understory, dead or stressed trees, and canopy connections near structures. Measure continuity across the landscape rather than focusing only on the largest vegetation patch. Gaps such as driveways or maintained areas may slow continuity, but their condition and width still need confirmation.
Color and texture can suggest vegetation differences, yet they vary with season, illumination, and sensor. Treat classification as a mapped hypothesis until it has been checked against field conditions or a suitable reference layer.
Evaluating slope, aspect, and terrain-driven fire behavior
Aerial imagery provides visual terrain context, while elevation data supplies the geometry needed to examine slope and aspect. Pay attention to steep draws, ridgelines, saddles, and narrow corridors that may affect movement, access, or exposure. Terrain should be interpreted with wind and fuel conditions rather than in isolation.
Maps should show whether a conclusion comes from direct observation or from a modeled derivative such as slope. That distinction helps decision-makers understand which findings are relatively certain and which depend on assumptions.
Assessing roof materials, structures, and defensible space
At suitable resolution, imagery may reveal roof form, nearby vegetation, attachments, outbuildings, decks, fences, and apparent clearance. It generally cannot confirm every material, hidden ember pathway, or condition beneath a canopy. Use the image to prioritize inspection questions, not to certify construction details from above.
For specific heat-related inspection questions, Thermal Drone Inspections are documented as producing high-resolution thermal images that can pinpoint issues such as water infiltration, energy loss, faulty electrical systems, and compromised insulation. That is a distinct inspection use and should not be presented as a substitute for a wildfire risk assessment.
Mapping access routes, evacuation constraints, and utility corridors
Trace roads from the property or neighborhood to likely exits, noting pinch points, steep grades, dead ends, bridges, and vegetation encroachment. Review utility corridors and roadside fuels as connected systems. A route that appears open in one image may be constrained by seasonal vegetation, parked vehicles, or a condition the image cannot reveal.
Map primary and alternate routes separately, and identify where field confirmation is necessary. This makes the output more useful to emergency planners and property managers than a single undifferentiated access layer.
Recognizing post-fire erosion and debris-flow hazards
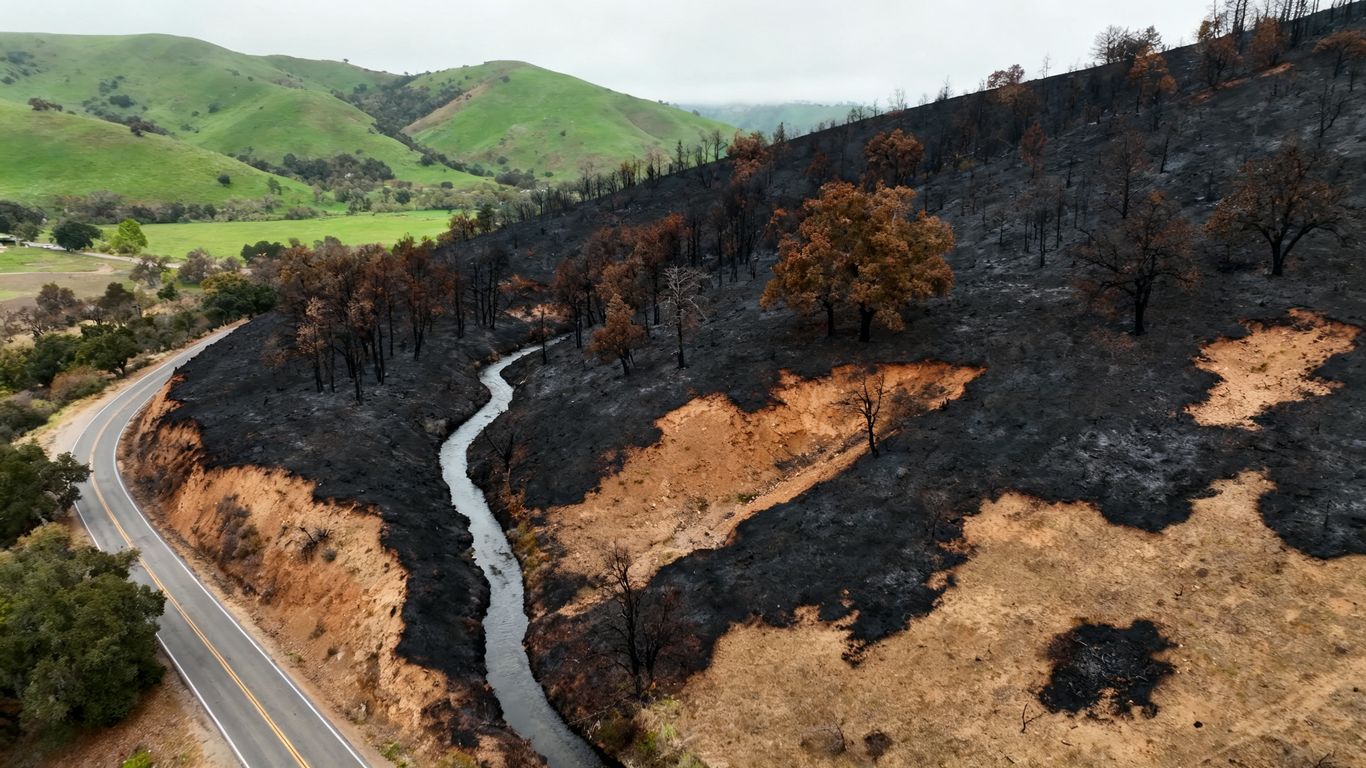
After fire, exposed soil, damaged vegetation, altered drainage, and unstable slopes can create hazards that persist beyond the flames. Compare pre-fire and post-fire imagery where possible, then inspect channels, road crossings, culverts, and slopes below burn areas. Rainfall timing and intensity should be included in the interpretation.
Post-fire erosion mapping can guide screening, but it does not by itself establish a site-specific engineering conclusion. Escalate locations with signs of instability or blocked drainage for appropriate professional review.
Validating aerial imagery-based risk assessments
Validation is where a visually persuasive map earns practical trust. It combines field observations, independent data, and transparent review rather than relying on image interpretation alone. The objective is not to eliminate every uncertainty; it is to show which findings are dependable and which require caution.
Ground-truthing observations with field inspections
Field crews should revisit a sample of mapped features, including both high-risk and apparently low-risk areas. Confirm vegetation classes, roof surroundings, road conditions, slope breaks, drainage features, and access constraints. Record disagreements with enough detail to improve the mapping method.
Field checks should follow safe access procedures and avoid implying that aerial data alone constitutes a land survey or a regulatory determination. The role of the image is to make inspection more focused and better documented.
Measuring accuracy across different landscapes
Accuracy can change between dense forest, open grassland, steep terrain, suburban neighborhoods, and recently burned areas. Use representative samples rather than validating only easy-to-see features. Track omission errors, false positives, positional differences, and the confidence of each class.
A single overall accuracy number can hide important weaknesses. A map may perform well in open terrain while missing understory conditions beneath dense canopy, so results should be reported by landscape type where feasible.
Accounting for cloud cover, shadows, and seasonal changes
Clouds and smoke can obscure broad areas, while shadows can make healthy vegetation appear sparse or burned. Seasonal differences can alter both color and texture. Flag compromised areas directly on the map and avoid presenting them with the same confidence as clear, comparable imagery.
When repeat captures are available, compare like with like: similar sun angle, season, resolution, and processing where possible. If that is not possible, explain the limitation beside the finding rather than burying it in metadata.
Comparing imagery findings with fire modeling outputs
Fire behavior models can provide a useful independent perspective on spread, intensity, or ember exposure, but model outputs depend on inputs and assumptions. Compare broad patterns first, then investigate disagreements. A mismatch may reveal a poor fuel classification, unusual terrain, outdated data, or a limitation in the model.
The comparison should inform review priorities, not force the image to agree with a model. Combining independent evidence is most valuable when the reasons for agreement or disagreement remain visible.
Documenting uncertainty and confidence levels
Assign confidence according to image quality, feature visibility, data currency, field support, and the complexity of the interpretation. Use plain labels such as high, moderate, and low confidence with definitions that are consistent across the project. Include unresolved questions and the conditions that would change the assessment.
This makes the final product more honest and more actionable. Decision-makers can then direct limited time toward low-confidence areas instead of treating every mapped feature as equally certain.
Applying assessment results to mitigation decisions
An assessment is useful only when it changes what a team does next. The output should connect each finding to an owner, a feasible action, a timeframe, and a method for checking progress. Priorities may differ between a homeowner, a utility operator, a public agency, and a community, even when they share the same imagery.
Prioritizing vegetation management and fuel reduction
Rank treatments by continuity, proximity to structures, slope, access, ecological considerations, and likely consequence. Distinguish routine maintenance from work requiring permits, specialist review, or coordination across property lines. A map can show where treatment may matter most, but it should not prescribe unreviewed work in sensitive terrain.
Treatments should also be monitored after completion. Before-and-after imagery can document whether gaps remain open, whether regrowth has occurred, and whether work created new access or erosion concerns.
Supporting property-level resilience planning
Property-level planning can use imagery to organize questions about roofs, vents, decks, fences, vegetation, driveways, storage, and emergency access. The assessment should separate observations from recommendations and identify what must be confirmed on site. This approach gives owners a practical sequence instead of an alarming but vague risk label.
Where construction, inspection, or permitting decisions are involved, coordinate with the appropriate qualified professionals and authorities. Aerial information supports planning; it does not replace required inspections or regulated services.
Informing community evacuation and emergency response
At community scale, mapped access constraints can support route review, staging plans, communication priorities, and identification of isolated areas. Include alternate routes and likely bottlenecks, not just the shortest path. Update the analysis when roads, vegetation, construction, or population patterns change.
Emergency planning should also account for conditions imagery cannot capture, including real-time closures, smoke, traffic, and changing fire behavior. Aerial assessment is one input in a larger operational picture.
Guiding insurance, infrastructure, and land-use decisions
Consistent imagery and supporting records can help organizations compare properties, infrastructure corridors, and proposed development areas. The evidence is strongest when dates, methods, limitations, and validation results travel with the map. Avoid presenting an image-derived indicator as a final underwriting, engineering, or land-use determination unless the responsible authority has accepted it.
For infrastructure, repeatable visual records can support maintenance planning and risk communication. For land-use decisions, they can reveal relationships among terrain, vegetation, access, and nearby development that deserve further review.
Establishing a repeat-imaging and monitoring schedule
Monitoring frequency should follow the rate of change and the consequence of missing it. Stable terrain may need periodic review, while active construction, recent fire, rapid vegetation recovery, or exposed utility corridors may justify more frequent capture. Use the first assessment as a baseline with fixed boundaries and documented capture conditions.
A simple schedule should name the area, trigger, data source, responsible reviewer, and expected output. Consistency turns separate flights into a useful record of change rather than a series of unrelated images.
Conclusion
Aerial imagery can make wildfire risk easier to see across Northern California, but its value comes from disciplined interpretation, supporting data, validation, and clear decisions. When your team needs organized drone-based imaging or aerial data capture for a defined project, contact Aeroskape to discuss an appropriate scope, capture plan, and decision-ready deliverable.
Frequently Asked Questions
What can aerial imagery reveal about wildfire risk?
It can show vegetation continuity, structures, roads, terrain patterns, apparent defensible space, access constraints, and post-fire changes. Some conditions still require field inspection or additional data.
Is drone imagery better than satellite imagery for wildfire assessment?
Neither is universally better. Drone imagery usually offers closer detail over smaller areas, while satellite imagery supports broad coverage and repeat observation. The best choice depends on scale, timing, resolution, and the decision being made.
How often should wildfire risk imagery be updated?
Update frequency should reflect how quickly conditions change and the consequences of outdated information. Recent fire, construction, vegetation growth, severe weather, or infrastructure work may justify more frequent review.
Can aerial imagery determine whether a property is safe?
No. Imagery can identify visible indicators and prioritize questions, but it cannot account for every material, hidden condition, weather event, or emergency circumstance. A qualified review is needed for site-specific conclusions.
What supporting data should accompany aerial imagery?
Useful supporting data may include elevation, slope, aspect, vegetation, parcel boundaries, roads, utility corridors, historical fire perimeters, weather records, and field observations. Dates and data quality should be documented for each layer.
How are post-fire erosion risks assessed from imagery?
Reviewers compare pre-fire and post-fire conditions, examining exposed soil, drainage paths, slope changes, damaged vegetation, and infrastructure near channels. Rainfall and field evidence are important for interpreting potential debris-flow hazards.
How should uncertainty be reported in a wildfire risk map?
Use clear confidence categories based on image quality, feature visibility, data currency, field validation, and modeling assumptions. Mark areas that are obscured, outdated, or unresolved instead of presenting all findings with equal certainty.